分布式度量系统prometheus初体验
背景
度量系统我们则会使用prometheus。
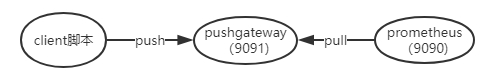
prometheus默认采用pull的方式,定时到指定的接口去拉取数据。
也可以通过pushgateway服务,push数据到pushgateway,再由prometheus从pushgateway拉取数据。
初体验
 [5]
[5]
安装prometheus
参考[1]
docker pull prom/node-exporter
docker pull prom/prometheus
docker pull grafana/grafana
docker pull prom/pushgateway
运行prometheus
参考[1]
docker run -d --name prometheus –-net=host -p 9090:9090 prom/prometheus
确认安装成功,输入下面的网址,打开web页面。
http://localhost:9090/graph
复制容器内部的配置文件到宿主机
docker cp -a prometheus:/etc/prometheus/ prometheus
重新启动
docker run -d --name prometheus -p 9090:9090 -v prometheus:/etc/prometheus prom/prometheus
安装node-exporter
docker run -d --name node-exporter -p 9100:9100 prom/node-exporter
确认安装成功,输入下面的网址,打开web页面。
http://localhost:9100/metrics
结果如下
# HELP go_gc_duration_seconds A summary of the pause duration of garbage collection cycles.
# TYPE go_gc_duration_seconds summary
go_gc_duration_seconds{quantile="0"} 0
go_gc_duration_seconds{quantile="0.25"} 0
go_gc_duration_seconds{quantile="0.5"} 0
go_gc_duration_seconds{quantile="0.75"} 0
安装grafana
启动
docker run -d --name=grafana -p 3000:3000 grafana/grafana
确认安装成功,输入下面的网址,打开web页面。
http://localhost:3000/
默认账号:admin / admin
添加数据源,选择Prometheus[6],地址选择实际的IP地址,如192.168.31.100。
安装cadvisor(可选)
cadvisor可以用来监控容器内的信息[1]。
docker pull google/cadvisor
安装pushgateway
docker run -d --name=pushgateway -p 9091:9091 prom/pushgateway
确认安装成功,访问:
http://127.0.0.1:9091/api/v1/status
得到
{
	"status": "success",
	"data": {
		"build_information": {
			"branch": "HEAD",
			"buildDate": "20211011-17:51:55",
			"buildUser": "root@f68dbd4cbcde",
			"goVersion": "go1.16.9",
			"revision": "99981d7be923ab18d45873e9eaa3d2c77477b1ef",
			"version": "1.4.2"
		},
		"flags": {
			"log.format": "logfmt",
			"log.level": "info",
			"persistence.file": "",
			"persistence.interval": "5m0s",
			"push.disable-consistency-check": "false",
			"web.config.file": "",
			"web.enable-admin-api": "false",
			"web.enable-lifecycle": "false",
			"web.external-url": "",
			"web.listen-address": ":9091",
			"web.route-prefix": "",
			"web.telemetry-path": "/metrics"
		},
		"start_time": "2022-02-02T12:03:34.0620457Z"
	}
}
修改prometheus.yaml,生效:
global:
  scrape_interval: 15s

scrape_configs:
  - job_name: "prometheus"
    static_configs:
    - targets: ["localhost:9090"]
  # 加入下面这几行
  - job_name: pushgateway
    static_configs:
      - targets: ['192.168.31.100:9091']
        labels:
          instance: pushgateway
重启 prometheus容器生效
docker restart prometheus
访问:http://localhost:9090/targets,确认其中有pushgateway
进一步阅读见[3]。
使用java sdk向pushgateway写入数据
参考[4],依赖
<dependency>
            <groupId>io.prometheus</groupId>
            <artifactId>simpleclient</artifactId>
            <version>0.14.1</version>
        </dependency>

        <dependency>
            <groupId>io.prometheus</groupId>
            <artifactId>simpleclient_pushgateway</artifactId>
            <version>0.14.1</version>
        </dependency>
示例代码
import io.prometheus.client.Counter;
import io.prometheus.client.Gauge;
import io.prometheus.client.exporter.PushGateway;

import java.io.IOException;
import java.util.Random;

public class MainServer {
    public static void main(String[] args) throws IOException, InterruptedException {
        PushGateway gateway = new PushGateway("localhost:9091");

        Random rnd = new Random();

        Counter counter = Counter.build()
                .name("page_visit") //模拟页面访问量
                .labelNames("page_id") //页面id
                .help("counter_page_visit") // 备注名称
                .register();
        Gauge gauge = Gauge.build()
                .name("page_fans") //这里模拟粉丝数(注:这里我们没设置label)
                .help("gauge_page_fans")
                .register();

        while (true) {
            //随机生成1个blogId
            int blogId = rnd.nextInt(100000);

            //该blogId的访问量+1
            counter.labels(blogId + "").inc();

            //模拟粉丝数的变化
            if (blogId % 2 == 0) {
                gauge.inc();
            } else {
                gauge.dec();
            }

            //利用网关采集数据
            gateway.push(counter, "job-counter-test");
            gateway.push(gauge, "job-gauge-test");

            //辅助输出日志
            System.out.println("blogId:" + blogId);
            Thread.sleep(5000);
        }
    }
}
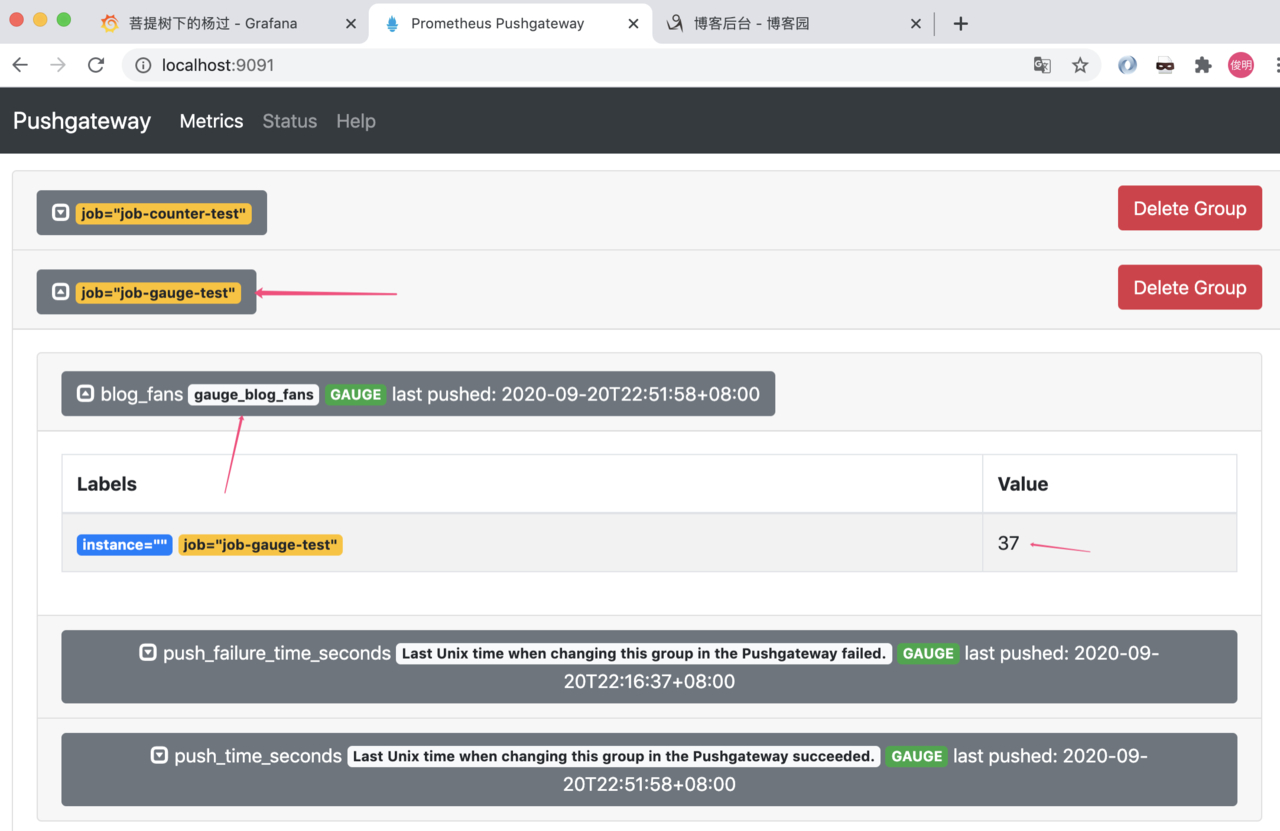
打开 http://localhost:9091/,可以看到job是否执行成功[4]。
在 grafana中可以增加配置[4]。

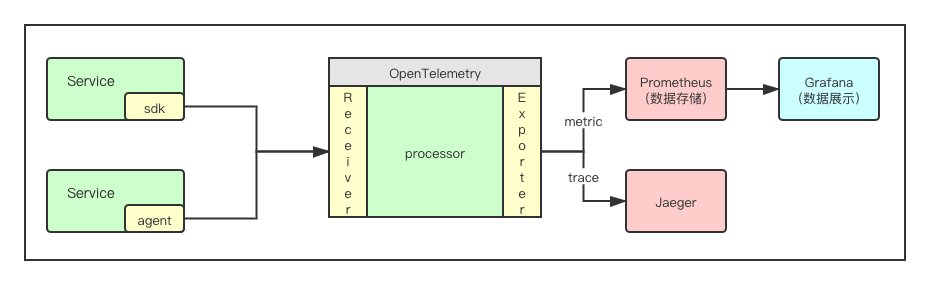
使用OpenTelemetry进行采集
根据[7]上的信息,Metrics的API和Protocol已经stable,SDK处于feature-freeze状态,尚未stable。
所以先观望一段时间,等对应的SDK出来。如果急切了解API的话,可以继续参考[2],依赖
<dependency>
    <groupId>io.opentelemetry</groupId>
    <artifactId>opentelemetry-api</artifactId>
    <version>1.10.1</version>
</dependency>
其中 opentelemetry-api 中包含了baggage,metrics和trace的接口,没有实现。在GlobalOpenTelemetry中定义了TracerProvider,MeterProvider等接口。
由于OTEL采用了接口和实例分离的方式,上面的api中只有对应的接口,没有实现。如果不加载对应的实现包,则都会调用noop方法。
主动发送有block风险。
被动采集更好一些。
参考
- docker安装prometheus
- OpenTelemetry Metrics Exporter - Prometheus
- prometheus学习笔记(1)-mac单机版环境搭建
- prometheus学习笔记(2)-利用java client写入数据
- OpenTelemetryCollector-数据集散中心
- 基于docker 搭建Prometheus+Grafana
- OpenTelemetry Status